A 2017 study from Harvard researchers1 showed the costs of increases in short-term exposure to PM2.5 for just the US 65+ year old Medicare fee-for-service beneficiaries were as much as 100 million dollars of in-patient and post-acute care costs, and a 6.6 billion dollar increase in cost of avoiding death, per 1 µg/m3 PM 2.5 increase. These costs were incurred even when PM2.5 levels remained below WHO air quality guidelines, and these PM2.5 increases occurred more than 122 days each year within each zip code of residence!
The Harvard T H Chan School of Public Health researchers in Boston, MA, analysed total countrywide hospital admissions for US Medicare fee-for-service beneficiaries aged 65+ over the years 2000-2012, using a time-stratified crossover analysis with conditional logistical regressions, which is an approach widely applied to estimate acute health affects to short-term exposure to air pollution.
Control matching for each individual was used to eliminate confounding variables (meteorological, location, age, gender, socio-economic status etc). PM2.5 levels were mapped to patient’s zip code of residence using the average value from the day of admission and the day before. PM2.5 values were modelled for zip codes using a previously validated approach calibrated with daily measurements by the US Environmental Protection Agency (EPA) at 1928 locations.
Overall, 95,277,169 urgent or emergent hospital admissions (i.e. excluding scheduled appointments) were assessed. From these data, it was established that not only did the analysis capture previously identified causes of adverse discharge destination (death, discharge to skilled nursing facilities or discharge to home healthcare services) obviously linked to air pollution, such as cardiovascular and respiratory diseases, diabetes mellitus with complications and Parkinson’s disease; but also conditions never previously associated with air pollution such as septicaemia, skin and subcutaneous tissue infections, urinary tract infections, renal failure, and fluid and electrolyte disorders showed statistically significant correlations with increases in air pollution. Many of these have underlying inflammatory contributions, likely arising directly as a consequence of the chronic inflammatory stimulus of PM2.5 lodging within these tissues after infiltration from the bloodstream.
Over this period the most numerous group of hospital admissions, 9 million people, were from unrelated causes: injury and poisoning (used as the negative outcome control for this study). The next most numerous cause of admission, non-hypertensive heart failure (already known to strongly correlate with air pollution) was 6.6 million people.
This study classified results in terms of per 1 µg/m3 increase in PM2.5 averaged from the day before and day of admission. Over this period there were 5,692 increased hospital admissions per 1 µg/m3 PM 2.5 increase. Each 1 µg/m3 PM 2.5 increase was associated with the following unfavourable discharge conditions: 634 additional deaths upon discharge, 1281 increased discharges to skilled nursing facilities, and 835 increased discharges to home healthcare services. Each 1 µg/m3 PM 2.5 increase was associated with an increase of 32,314 days in hospital, with an increase of costs of in-patient and post-acute care costs of 100 million USD (adjusted to 2017 dollar values). This cost per 1 µg/m3 PM 2.5 increase is equivalent to 0.1% of the total Medicare claims value for the year 2012. The increased value of statistical lives lost at discharge (i.e. the economic value used to measure the cost of avoiding death) was 6.6 billion USD at 2017 dollar values. This is further broken down in Table 1 into total, previously associated conditions and conditions newly associated with air pollution.
The increased percentage absolute risk of hospital admissions per 10 million people for each 1 µg/m3 PM 2.5 increase was 0.2 – 0.68% for each condition, a relative percentage increase in risk of 0.05 – 0.4%. That is a relative increase of up to 40,000 people per 10 million population.
The scale of a 1 µg/m3 increase in PM2.5 relative to air quality indices (AQI) is shown in Figure 1 below. The global 2018 AQI for PM2.5 is shown in Figure 2, below.
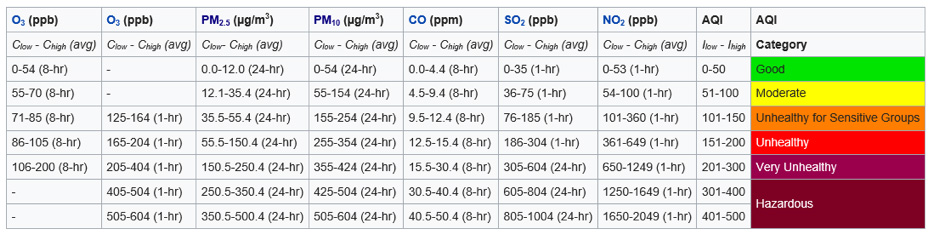
Figure 1. AQI indices and relevant measurements of contributing factors, including PM2.5, measured in µg/m3.
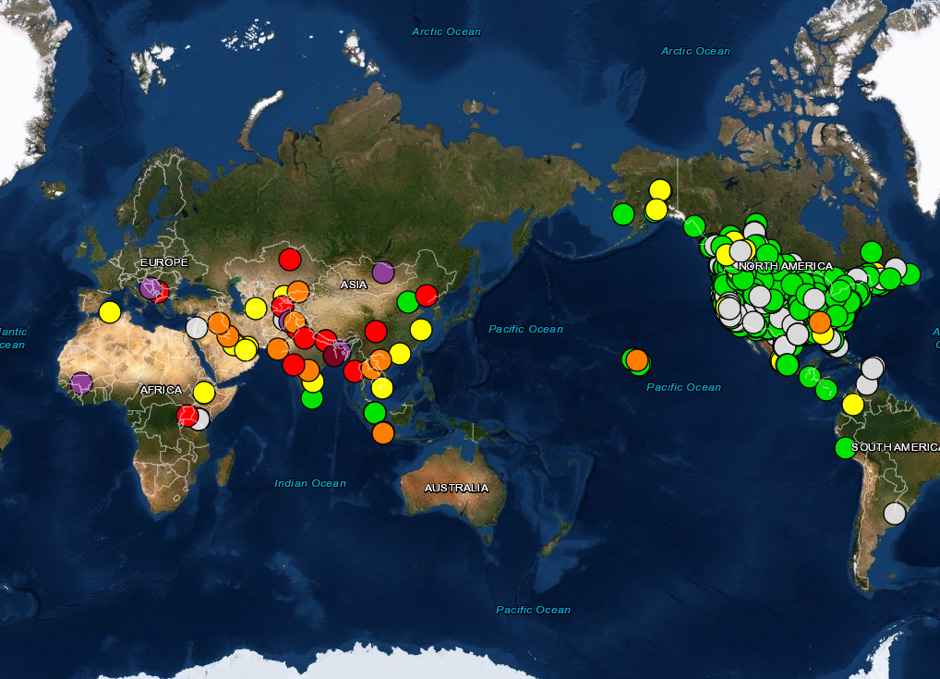
Figure 2. Global AQI for PM2.5 in 2018.
Table 1. Increased costs associated with short term exposure to 1 µg/m3 increases in PM2.5 air pollution (averaged from day of hospital admission and day before admission), broken down to previously associated conditions, newly associated conditions, and total.
| COST | Previously associated | Newly associated | TOTAL |
| Hospital admissions | 3,642 (3434-3851) | 2,050 (1914-2187) | 5,692 |
| Deaths at discharge | 397 (340-453) | 237 (193-281) | 634 |
| Discharges to skilled nursing facilities | 711 (671-751) | 570 (532-608) | 1,281 |
| Discharges to home healthcare services | 538 (508-568) | 297 (277-317) | 835 |
| Days in hospital | 20,098 (18,950-21,247) | 12,216 (11,358-13,075) | 32,314 |
| In-patient and post-acute care costs (in 2017 equivalents) | 69 million USD (65-73) | 31 million USD (29-34) | 100 million USD |
| Value of statistical lives lost at discharge (in 2017 equivalents) | 4.1 billion USD (3.5-4.7) | 2.5 billion USD (2.0-2.9) | 6.6 billion USD |
Reference
[1] Wei Y, Wang Y, Di Q, Choirat C, Wang Y, Koutrakis P, Zanobetti A, Dominici F, Schwartz JD. (2019) Short term exposure to fine particulate matter and hospital admission risks and costs in the Medicare population: time stratified, case crossover study. BMJ. Nov 27;367:l6258. doi: 10.1136/bmj.l6


_EV_Recognition")
